My blog has moved to jimdehner.com
Thank you for all the support over the past 2 years - I recently updated my blog to make it easier to read, improve the rendering of images and tie back to video presentations that are associated with the content - Check it out at Jim's new blog -
Frequently we see questions on how identify the Top N and group the "Other".
A common problem with many business applications - determining the Top N can be easily done in a number of ways. (Presented on VizConnect - see the recording at Link to Recording)
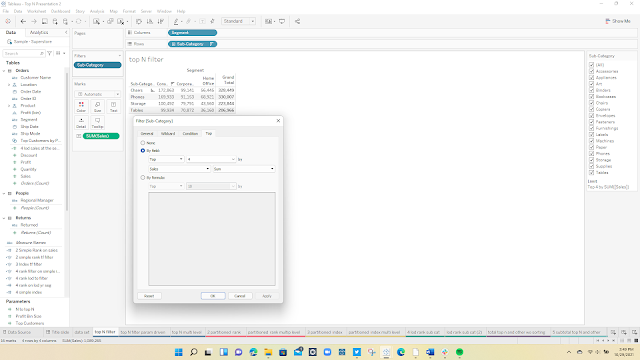
1 The Top N filter
Just apply a Top N filter to the dimension
A more typical question adds some complexity where the user wants to see the Top N across multiple dimensions which can be solved using Index() or Rank()


It works well but there is a need to pre sort the data and when there are multiple dimensions you will need to determine which column to use in the sort:

3 The Rank solution
An alternative is to use a ranking based on either a measure or an LOD. All forms of Rank are table calculations and look something like this:
RANK_UNIQUE(sum([Sales]),'desc')
and each segment can be treated independently without presorting the data:

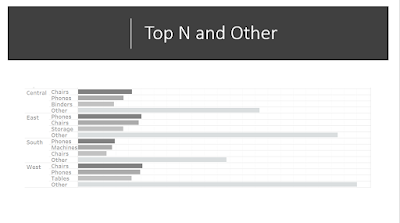
4 Top N and Other
Users often want to see the Top N individually and group the remaining as "Other". It requires a complex solution that combines both LOD's, Table Calculation, the use of Show/Hide filters and a hack
Start with an LOD to find the Top N and "Other" based on subcategory and region (Note I am using Include to support drilling down into the Region Hierarchy) :
{ INCLUDE [Region],[Category]:sum([Sales])}
and then Rank the LOD
rank(sum([6 lod sales region subcat]),'desc')
to start building a data table for the viz like this

for flexibility I added a parameter to set the N level for the Top N and created this T/F calculation
[6 rank for lod sub reg]<=[N to top N]
and used this to add a Label to the "Other" group
if [6 rank tf ] then attr([Sub-Category]) else "Other" end
the data table now look like this:

use a table calculation to total the "Other"
window_sum(if [6 subcat and other label]="Other" then sum([6 lod sales region subcat]) end)
and restart every Region places the Other Total on all subcategories not in the Top N - after sorting the table now looks like this

Now the hack, we only want to see each of the Top N subcategories and 1 of the subcategories labeled "Other" in each region - That is done with a show hide filter:
if [6 rank for lod sub reg]<=[N to top N]+1 then "show" else "hide" end
After applying the filter and hiding the real subcategory labels the data table is complete

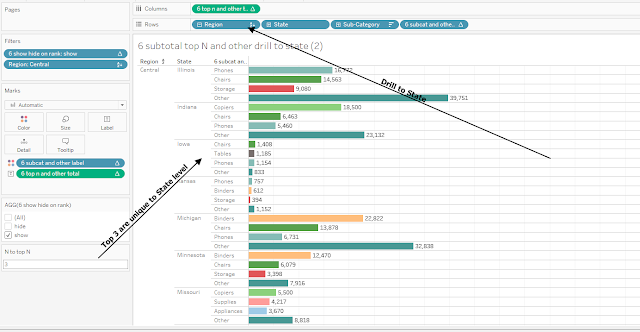
as a bar chart the results look like this

5 Drill down in Hierarchy
One advantage of using the Include LOD is that it supports drill into the hierarchy finding the Top N at subsequently lower levels

Hope this helps the next time you need to find the Top N and group the Other
The examples used here,and a few others, can be downloaded at workbook here
Enjoy
Jim
No comments:
Post a Comment
Note: Only a member of this blog may post a comment.